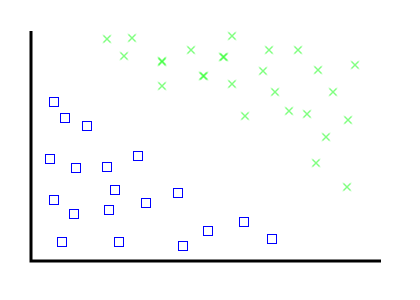
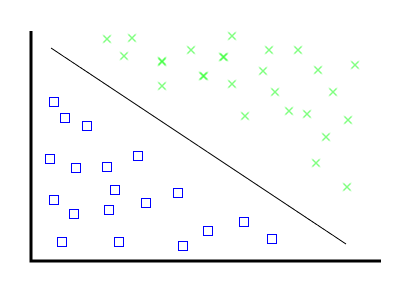
Linear Separation: Step 1
(Portland Python, March 2008) (john melesky)
Take facts, turn it into knowledge.
Take facts, turn it into knowledge, algorithmically.
Also known as "unsupervised learning", it's what you do when you have a whole lot of unstructured data you know little about.
The problem: check the spelling of things that aren't in the dictionary
The problem: check the spelling of things that aren't in the dictionary
Indigo MontoyaNumbers we have include: number of times a query is made, distance between queries (e.g., Levenshtein distance)
Numbers we have include: number of times a query is made, distance between queries (e.g., Levenshtein distance)
When a new query comes in, find the most common query within a short distance and suggest it.
Numbers we have include: number of times a query is made, distance between queries (e.g., Levenshtein distance)
When a new query comes in, find the most common query within a short distance and suggest it.
And that's it.
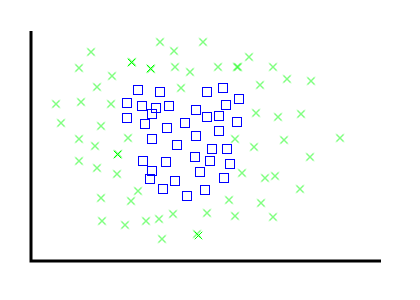
Problem: given a big pile of documents, figure out what different categories there are.
Solution: simple geometry
Solution: simple (high-dimensional) geometry
Solution: (a whole lot of) simple (high-dimensional) geometry
When you already know something about your data, and you want to apply that knowledge to more, less-known data
You have 100 documents in two different categories. Predict the category for the next 5000 documents.

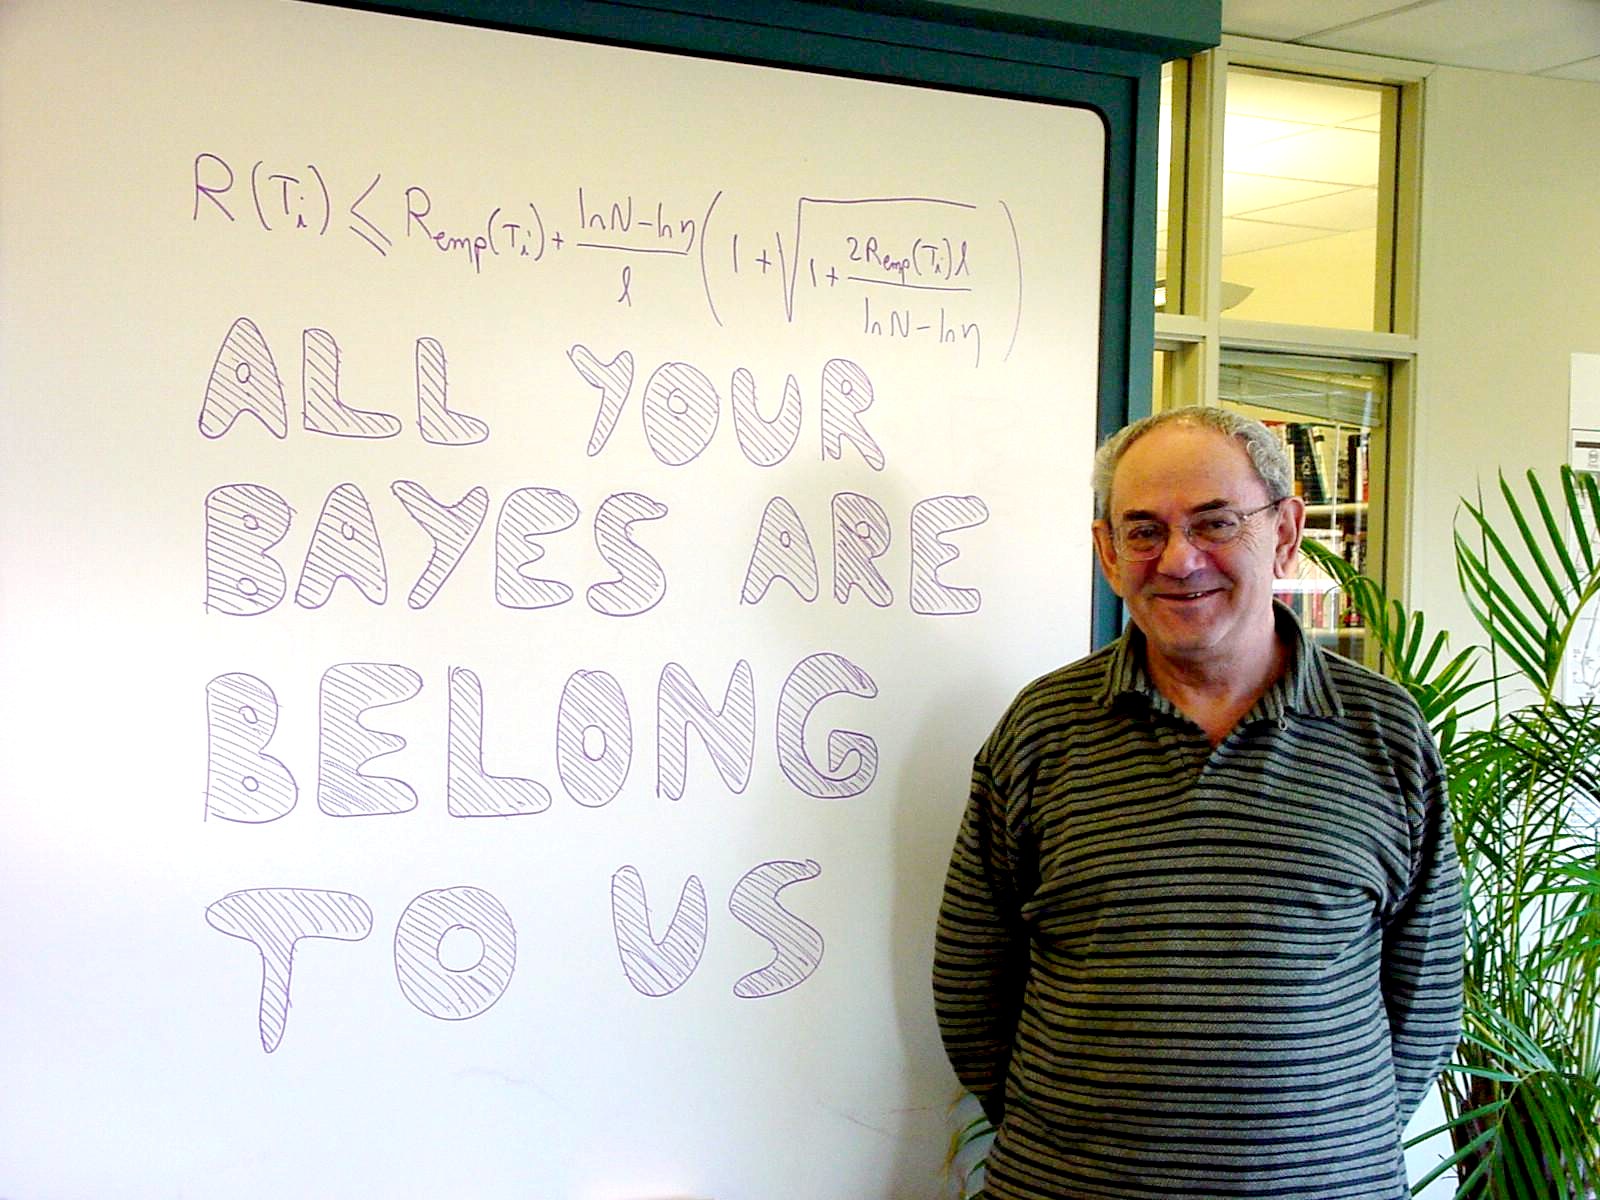
Not geometric, but statistical.
Future probabilities derived from prior probabilities
If a drug test has 95% accuracy, and Bob tests positive, what is the probability that he uses drugs?
If a drug test has 95% accuracy, and Bob tests positive, what is the probability that he uses drugs?
(hint: it's not 95%)
Answer: Depends on how many people use drugs.
Answer: Depends on how many people use drugs.
If the rate of drug use is 1%, then we have:
| test positive | test negative | |
|---|---|---|
| users | 95% of 1% | 5% of 1% |
| non-users | 5% of 99% | 95% of 99% |
Answer: Depends on how many people use drugs.
Number of positive results: 0.95% + 4.95% == 5.9%
Number of correct positive results: 0.95% / 5.9% == 16.1%